Changes in Expenditures by State (2019 - 2020)
The purpose of this project was to analyze how spending patterns changed in the United States after the onset of the COVID-19 pandemic. To accomplish this analysis, I pulled personal consumption expenditures (PCE) data from the Bureau of Economic Analysis (BEA).
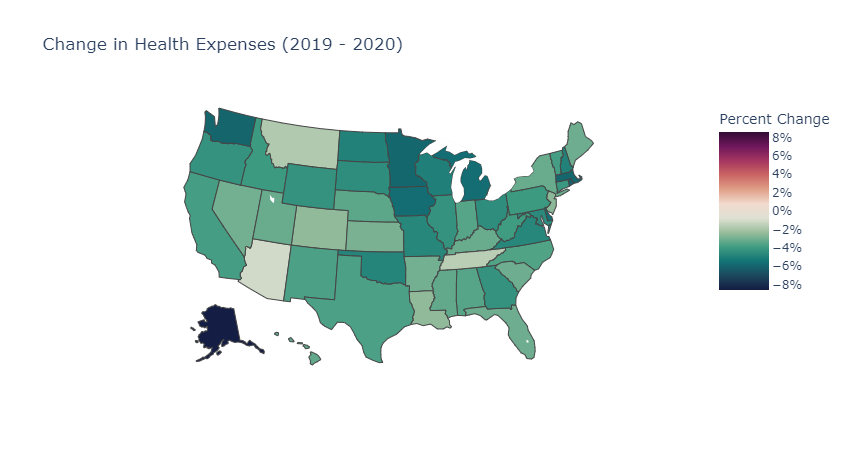
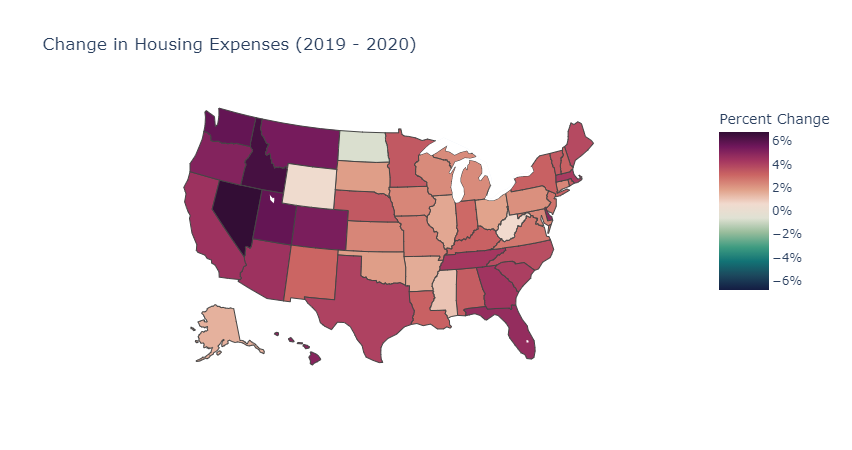
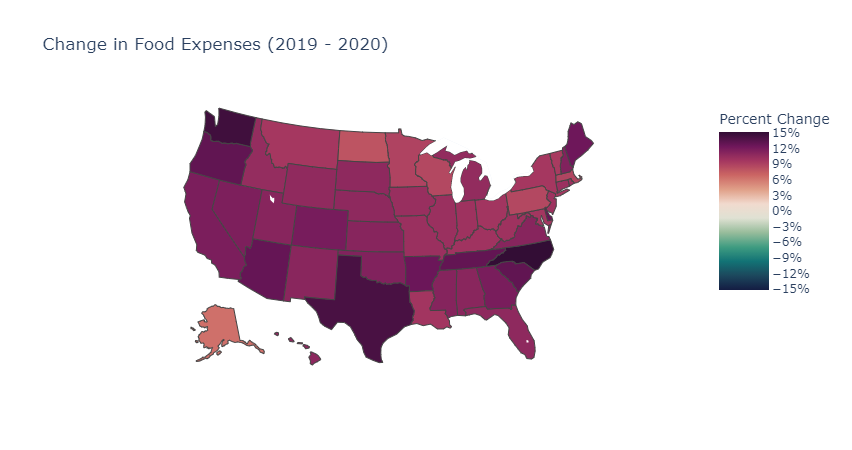
After cleaning the data, I used Plotly to create choropleth maps to visualize changes in various expenditures across the country. The expenditures explored include: food, health, housing, and transportation. The site provides the source data and visualizations created as part of the analysis, as well as explanations and descriptions of any significant changes witnessed.
Visualizations